


The Doji is a single-candle pattern representing market indecision. It forms when an asset's opening and closing prices are virtually identical, creating a paper-thin body with upper and lower wicks that signal a potential trend pause or reversal.
Key Characteristics
Market Psychology: Buyer vs. Seller Standoff
The long wicks reflect an intense struggle between bulls and bears during the session. Because price closes back at its opening level, neither side gained control—signaling that the prevailing trend is losing momentum.
3 Execution Rules
Key Takeaway: A Doji isn't an instant entry trigger—it's a warning signal. Wait for the confirmation candle, use the Doji's wicks to cap your risk, and trade with the confirmed momentum.

The Long-Legged Doji is a powerful candlestick pattern that signals extreme market indecision. Characterized by dramatically elongated upper and lower wicks with an identical (or near-identical) open and close price, it marks a session of heavy volatility where neither side retained control.
Anatomy & Market Psychology: Buyers and Sellers Reach a Draw
3 Execution Rules
Key Takeaway: A Long-Legged Doji shows a violent tug-of-war ending in a tie. Use the extreme wicks to anchor your Stop Loss, and wait for the confirmation candle to tell you which side won before executing.
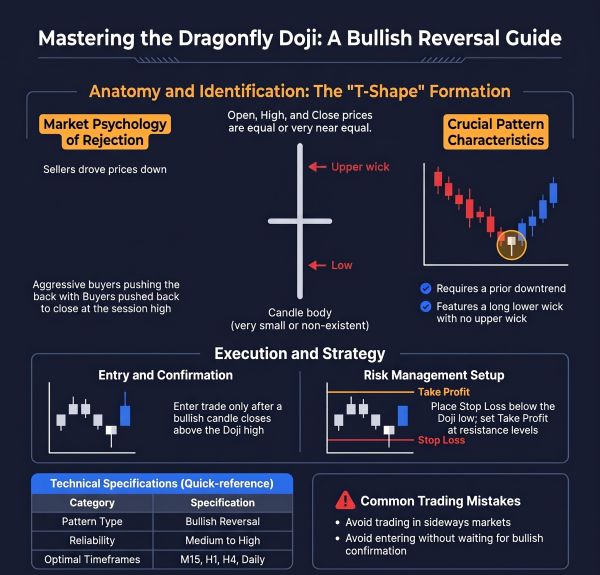
The Dragonfly Doji is a distinct "T-shaped" candlestick pattern that signals a strong bullish reversal. It forms when the open, high, and close prices are virtually identical at the top of the candle, leaving a long lower wick that reflects aggressive downward price rejection by buyers.
Quick-Reference Specifications
Market Psychology of Rejection
Sellers initially dominated the session, driving prices lower. However, buyers stepped in with strong conviction, pushing price all the way back up to close at the session high. This long lower-wick rejection demonstrates that bears are losing control and a bottom may be forming.
Execution & Risk Rules
Key Takeaway: The Dragonfly Doji is a visual signal of buyer rejection at low prices. Confirm the takeover on the next candle, anchor your Stop Loss beneath the lower wick, and target nearby resistance.
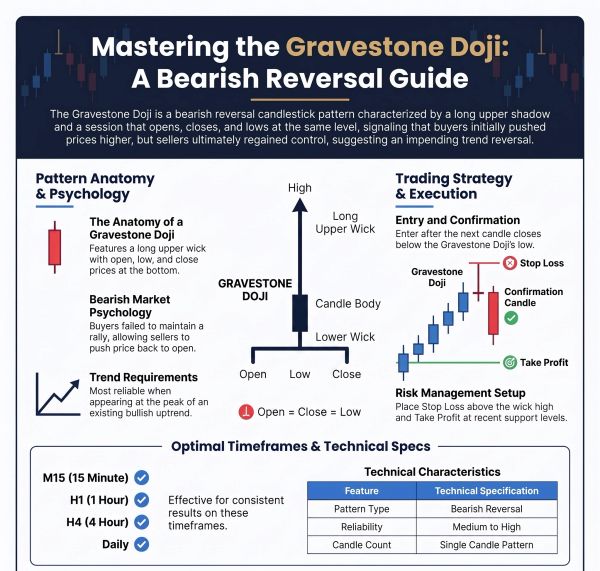
The Gravestone Doji is a powerful single-candle pattern that signals a strong bearish reversal. It features a dramatic, long upper wick, with the opening, closing, and low prices all converging at the very bottom of the candle, visually illustrating a massive rejection of higher prices by the market.
Quick-Reference Specifications
Market Psychology of Rejection
Buyers initially dominated the session, driving prices significantly higher to form the long upper wick. However, sellers stepped in with intense conviction, pushing the price all the way back down to close at its session low. This failure of the rally demonstrates that bulls have exhausted their power and sellers have regained total control.
Execution & Risk Rules
Key Takeaway: The Gravestone Doji is a powerful visual of immense seller rejection and buyer failure. Use the guide found in the image to confirm the takeover on the next candle, anchor your Stop Loss above the wick high, and target nearby support.
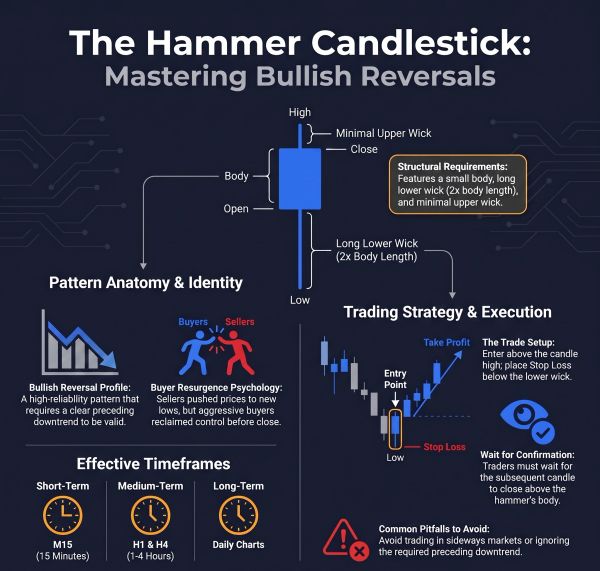
The Hammer is a classic single-candle pattern that signals a strong bullish reversal. It features a small real body at the top of the session's range and a long lower wick—at least twice the length of the body—reflecting strong rejection of lower prices by aggressive buyers.
Quick-Reference Specifications
Market Psychology: Buyer Resurgence
Sellers initially dominated the session, pushing prices to new lows. However, aggressive buyers stepped in before the close, absorbing the sell pressure and driving price all the way back up near the session high. This sharp rejection demonstrates that bears have lost control and momentum is shifting back to the bulls.
3 Execution Rules
Key Takeaway: The Hammer signals that buyers have aggressively reclaimed control at market lows. Confirm the takeover on the next candle, anchor your Stop Loss beneath the lower wick, and ride the bullish momentum.
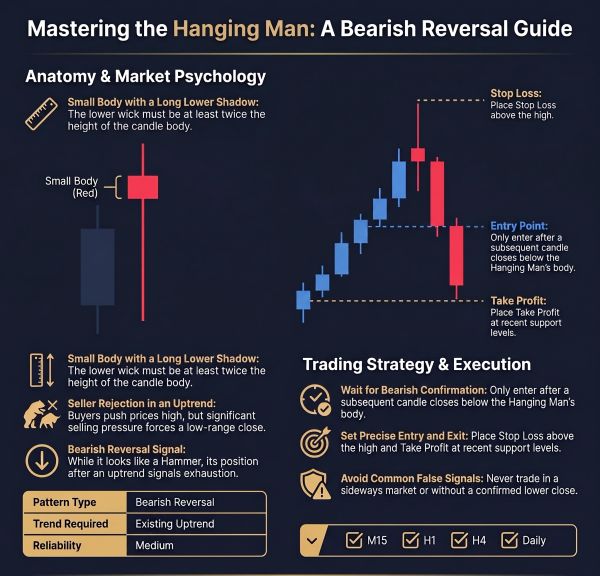
The Hanging Man is a crucial single-candle pattern signaling a potential bearish reversal. Although visually identical to a Hammer candlestick, its appearance at the peak of an existing uptrend is what makes it significant, indicating buyer exhaustion and impending selling pressure.
Quick-Reference Specifications
Market Psychology: Seller Rejection in an Uptrend
The session begins with bulls attempting to push prices higher. However, significant selling pressure emerges mid-session, driving prices sharply lower. While bulls manage to push the price back up near the highs by the close, the deep intra-session sell-off demonstrates that bears are becoming aggressive and the uptrend is losing momentum.
Trading Strategy & Execution
Key Takeaway: The Hanging Man warns of bull exhaustion at market highs. Confirm the bear takeover on the next candle, anchor your Stop Loss above the wick high, and ride the reversal momentum.
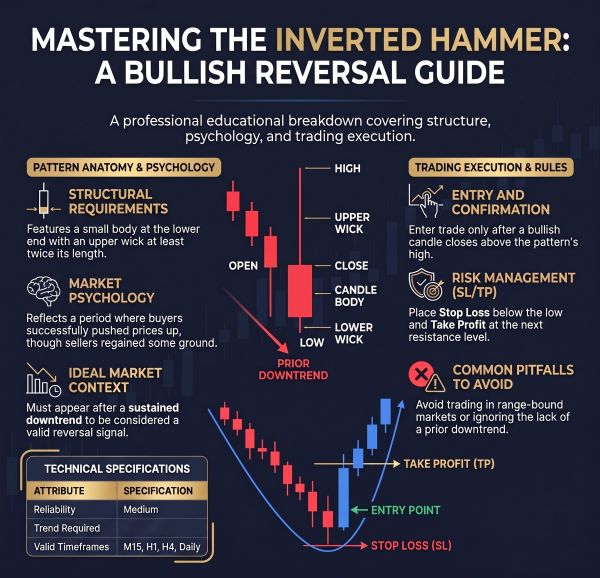
The Inverted Hammer is a single-candle pattern signaling a potential bullish reversal when it appears after a sustained downtrend. It's characterized by a small real body at the lower end of the trading range and a long upper wick—at least twice the body's length—reflecting a dramatic intra-session price rejection by buyers.
Quick-Reference Specifications
Market Psychology: Buyers Resurgence
This pattern reflects a session where aggressive buyers initially stepped in, driving prices significantly higher (forming the long upper wick). Though sellers regained some ground before the close, the pattern visually demonstrates that buyers are starting to absorb sell pressure and fight back, testing higher price levels for the first time in the downtrend.
3 Execution Rules
Key Takeaway: The Inverted Hammer is a visual warning that buyer interest is returning to test the downtrend's base. Confirm the shift with the next candle, anchor your Stop Loss below the low, and target nearby resistance.
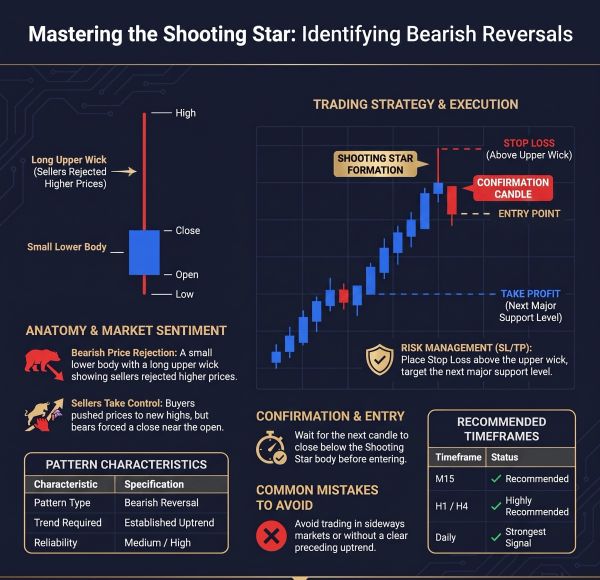
The Shooting Star is a single-candle pattern that signals a strong bearish reversal when it appears after an established uptrend. It is characterized by a small real body at the lower end of the trading range and a long upper wick—at least twice the length of the body—reflecting a severe rejection of higher prices by sellers.
Quick-Reference Specifications
Market Sentiment & Psychology: Bearish Price Rejection
Buyers initially pushed prices to new session highs, reflecting strong bullish sentiment. However, sellers stepped in with intense conviction, overwhelming the buy pressure and forcing the price all the way back down to close near the open and low. This sharp rejection demonstrates that bears have reclaimed total control and the uptrend's momentum is exhausted.
3 Execution Rules
Key Takeaway: The Shooting Star signals a complete exhaustion of buyers and an aggressive takeover by sellers at market peaks. Confirm the takeover on the next candle, anchor your Stop Loss above the upper wick, and ride the bearish reversal momentum, as outlined in the image above.
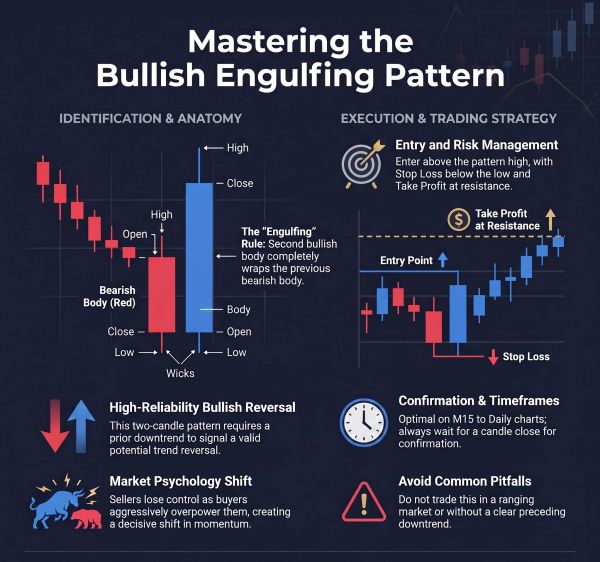
The Bullish Engulfing Pattern is a powerful two-candle formation that signals a high-reliability bullish reversal. It occurs at the end of a downtrend when a large bullish candle completely "engulfs" the real body of the preceding bearish candle, marking a decisive takeover by buyers.
Quick-Reference Specifications
Market Psychology: Decisive Momentum Shift
Sellers were initially in control, maintaining the downward momentum. However, on the second candle, aggressive buyers step in with overwhelming force—absorbing all sell pressure and driving the price to close above the prior candle's open. This visual "wrap" proves that bears have lost control and bulls are driving a momentum shift.
Execution & Risk Rules
Key Takeaway: The Bullish Engulfing Pattern shows buyers completely overpowering sellers. Confirm the body wrap on the candle close, anchor your Stop Loss below the pattern's low, and target the next major resistance.
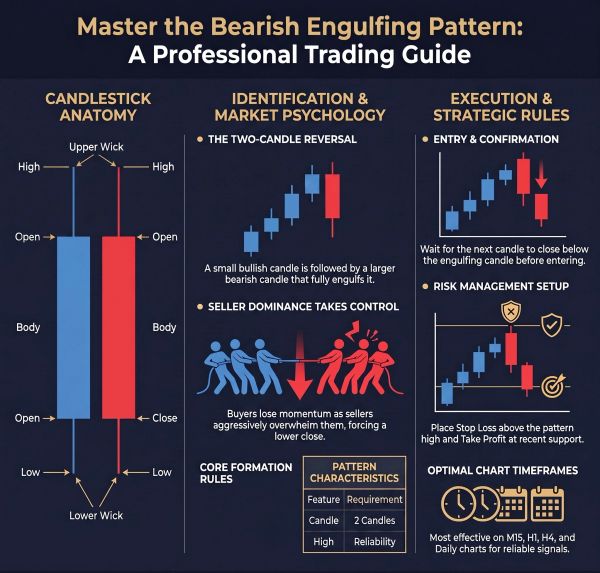
The Bearish Engulfing Pattern is a high-reliability two-candle formation that signals a strong bearish reversal. It occurs at the peak of an uptrend when a large bearish candle completely "engulfs" the real body of the preceding small bullish candle, signaling an aggressive shift in market control.
Quick-Reference Specifications
Market Psychology: Seller Dominance Takes Control
Buyers were initially in control, producing a small bullish candle. However, sellers step in with overwhelming volume on the second candle, absorbing all buy orders and forcing price to close below the prior candle's open. This visual wrap proves buyers have lost momentum and sellers have taken complete dominance.
3 Execution Rules
Key Takeaway: The Bearish Engulfing Pattern marks the exact moment sellers forcefully overwhelm buyers at market peaks. Confirm the lower close on the subsequent candle, anchor your Stop Loss above the pattern high, and target nearby support.

The Three Black Crows is a high-reliability three-candle pattern that signals a strong bearish reversal from a bullish trend. When properly validated, it indicates a massive shift in market momentum, where aggressive bears achieve total dominance and force prices significantly lower.
Pattern Identification & Market Psychology
Technical Rules for Execution
3. Avoid Common Pitfalls: Never trade this pattern in a sideways, ranging market or without receiving a confirmed long-bodied candle on each period. Never ignore the preceding uptrend context.
Key Takeaway: The Three Black Crows show a high-conviction bear takeover. Confirm the strong validation rules on three candle opens/closes, anchor your Stop Loss above the pattern peak, and ride the powerful reversal momentum.

The Three Inside Down is a high-reliability three-candle pattern that signals a strong bearish reversal. It occurs at the peak of a sustained uptrend when a large bullish candle is followed by a small bearish candle contained within its body, and is confirmed by a third candle closing below the second.
Quick-Reference Specifications
Market Psychology: Confirmation of Seller Dominance
Bulls initially push the price up with a large bullish candle (Candle 1). On Candle 2, buying power stalls, creating a small bearish candle completely contained within the body of Candle 1—signaling that buyers are losing control. Finally, Candle 3 breaks down and closes below Candle 2, confirming that sellers have taken full command.
3 Execution Rules
Key Takeaway: The Three Inside Down confirms a transition from buyer exhaustion to seller dominance. Wait for the 3rd candle close to validate the setup, anchor your Stop Loss above the first candle's high, and target nearby support.

The Three White Soldiers is a high-reliability three-candle pattern that signals a powerful bullish reversal. Appearing after an established downtrend, it consists of three consecutive long-bodied bullish candles ("soldiers") that mark a decisive shift from seller exhaustion to aggressive buyer dominance.
Quick-Reference Specifications
Market Psychology: Aggressive Buyer Dominance
Leading into the pattern, bears were in control. The appearance of three strong, consecutive bullish candles shows bears retreating as bulls take total control of price action. Each candle opening within the previous body and closing near its high—with little to no upper wick—proves that buyers are maintaining relentless pressure throughout each session.
3 Execution Rules
3. Use Optimal Timeframes: Stick to M15, H1, H4, or Daily charts for reliable signals—avoid M1 scalping timeframes where market noise invalidates the setup.
Key Takeaway: The Three White Soldiers pattern represents an indisputable takeover by buyers at market lows. Validate the candle structure, enter on the breakout or minor retest, anchor your Stop Loss below the first soldier, and target key resistance.

The Falling Three Methods is a high-reliability five-candle pattern that signals a decisive bearish continuation. It highlights a critical moment where bulls attempt a reversal but fail, allowing bears to aggressively resume control and continue the prevailing downtrend.
Quick-Reference Specifications
Market Psychology of Failed Reversals
The pattern visualizes a brief respite for the dominant bears. Following a strong initial bearish impulse (Candle 1), bulls take an intra-range pause with three consecutive small-bodied candles. However, the bulls lack the momentum to break beyond the high of the first candle, which signals persistent seller dominance and an impending resumption of the downtrend.
3 Execution Rules
Key Takeaway: The Falling Three Methods pattern represents a powerful confirmation that an existing downtrend is set to resume. Wait for the fifth candle to confirm seller dominance, anchor your Stop Loss above the first candle's high, and execute the trade with the confirmed momentum.

The Rising Three Methods is a high-reliability five-candle pattern that signals a strong bullish continuation. It represents a temporary pause (a "breather") in an existing uptrend where sellers attempt a shallow pullback but fail to break support, allowing buyers to step back in and drive the market higher.
Quick-Reference Specifications
Market Psychology: The "Breather"
Following a strong initial surge from buyers (Candle 1), the market takes a temporary breather. Sellers attempt a counter-attack with three small consecutive bearish candles (Candles 2, 3, and 4). However, sellers lack the conviction to break below the first candle's support level. On Candle 5, buyers surge back into the market with renewed strength, breaking out to close above the initial high and confirming trend persistence.
3 Execution Rules
Key Takeaway: The Rising Three Methods pattern proves that a pullback is merely a temporary pause before the primary uptrend resumes. Confirm the fifth candle's breakout close, anchor your Stop Loss below the first candle's low, and trade with the renewed bullish momentum.

The Tweezer Top is a two-candle pattern that signals a potential bearish reversal at the peak of an uptrend. It is defined by two consecutive candles testing the exact same price level, creating identical (or near-identical) highs that form a clear resistance "ceiling."
Quick-Reference Specifications
Market Psychology: Psychology of the Peak
On the first candle, buyers drive price up to a strong high. On the second candle, bulls attempt to push higher once more but hit an identical resistance ceiling. Unable to break through, buyers suffer exhaustion as sellers aggressively step in to force price downward—signaling a firm shift toward bear control.
3 Execution Rules
Key Takeaway: The Tweezer Top visualizes a double-rejection ceiling at market peaks. Confirm the bearish breakdown candle, anchor your Stop Loss above the matching highs, and target nearby support.

The Morning Star is a high-reliability three-candle pattern that signals a strong bullish reversal. Appearing at the base of a downtrend, it visualizes the exact moment selling momentum exhausts and buyers aggressively take control of price action.
Quick-Reference Specifications
Market Psychology: Sentiment Shift
3 Execution Rules
Key Takeaway: The Morning Star marks a clear shift from bear exhaustion to bull control. Confirm the setup on the third candle close, anchor your Stop Loss below the star low, and target nearby resistance.

The Evening Star is a high-reliability three-candle pattern that signals a strong bearish reversal. Appearing at the peak of an uptrend, it visualizes the shift from buyer dominance to aggressive seller control.
Quick-Reference Specifications
Market Psychology: Sentiment Shift
3 Execution Rules
Key Takeaway: The Evening Star marks a clear shift from bull exhaustion to bear control. Confirm the setup deep within the first candle's body after the third candle close, anchor your Stop Loss above the pattern high, and target major support

The Three Inside Up is a high-reliability three-candle pattern that signals a strong bullish reversal. It occurs at the base of a downtrend when a large bearish candle is followed by a smaller bullish "inside" candle, and is confirmed by a third bullish candle that breaks out to close above the first candle's high.
Quick-Reference Specifications
Market Psychology: Seller Trapping & Momentum Shift
Sellers initially dominate the market with a large bearish candle (Candle 1). On Candle 2, selling momentum completely stalls as a smaller bullish candle is trapped entirely within Candle 1's range. On Candle 3, buyers step in with strong conviction, pushing price up to close above the first candle and confirming that bulls have seized control.
3 Execution Rules
Key Takeaway: The Three Inside Up confirms a structural shift from bear exhaustion to bull takeover. Confirm the Candle 3 breakout close, anchor your Stop Loss below the pattern low, and target nearby resistance.

The Bearish Harami is a two-candle pattern that signals a potential bearish trend reversal. It reflects market indecision and buyer exhaustion when a small bearish candle forms entirely within the real body of the preceding large bullish candle.
Quick-Reference Specifications
Market Psychology: Buyer Exhaustion & Indecision
Following a strong upward rally driven by bulls (Candle 1), price action abruptly stalls. The second candle opens and consolidates entirely within the upper and lower bounds of Candle 1's body. This "inside" formation indicates that buying momentum has completely dried up, signaling a loss of control from bulls and an impending shift toward selling pressure.
3 Execution Rules
3. Avoid Common Mistakes: Do not trade this pattern in isolation against strong macro momentum, and never ignore the requirement for a clear preceding uptrend.
Key Takeaway: The Bearish Harami visualizes buyer exhaustion at market peaks. Wait for a confirmed bearish close below the pattern low, anchor your Stop Loss above the first candle's high, and target nearby support.

The Dark Cloud Cover is a two-candle pattern signaling a strong bearish reversal at the peak of an uptrend. It occurs when a large bullish candle is followed by a bearish candle that gaps up at the open but aggressively reverses, closing below the 50% midpoint of the first candle's real body.
Quick-Reference Specifications
Market Psychology: Sudden Shift in Sentiment
Bulls initially maintain dominance, opening the second candle with a gap up above the previous high (reflecting ongoing optimism). However, sellers aggressively step in, rejecting higher prices and forcing the market down deep into the first candle's real body. Closing below the 50% threshold demonstrates that bears have taken control and buyers are losing conviction.
3 Execution Rules
3. Ensure Valid Trend Context: Only trade this setup following an established, clear preceding uptrend—avoid applying this pattern during sideways or ranging market conditions.
Key Takeaway: The Dark Cloud Cover exposes a dramatic shift from buyer optimism to seller rejection at market peaks. Confirm the 50% body penetration and subsequent bearish candle close, anchor your Stop Loss above the pattern high, and target major support.

The Tweezer Bottom is a two-candle pattern that signals a potential bullish reversal at the base of a downtrend. It is defined by two consecutive candles sharing identical or near-identical lows—regardless of body color—creating a clear support floor where price is repeatedly rejected.
Quick-Reference Specifications
Market Psychology: Price Rejection at Support
Sellers initially push price down to hit a support level. On the second candle, bears attempt to push lower once again but hit the exact same price floor. Unable to break through, selling momentum exhausts, allowing buyers to step in and drive a decisive shift toward upward momentum.
3 Execution Rules
3. Avoid Common Pitfalls: Do not trade blindly against strong higher-timeframe trends, and never ignore major higher-timeframe resistance levels overhead.
Key Takeaway: The Tweezer Bottom visualizes a firm double-rejection support floor at market lows. Confirm the bullish follow-through, anchor your Stop Loss just below the matching lows, and target key resistance levels.

The Piercing Line is a two-candle pattern signaling a strong bullish reversal at the base of an established downtrend. It occurs when a long bearish candle is followed by a bullish candle that gaps down at the open but aggressively recovers to close well past the midpoint of the first candle's real body.
Quick-Reference Specifications
Market Psychology: The Shift in Sentiment
Sellers initially maintain control, pushing price down at the open with a gap down in alignment with the downtrend. However, sellers exhaust their momentum during this gap, allowing aggressive buyers to take control and drive price back up deep into the first candle's body. Closing above the 50% threshold proves that buyers have seized control of price action.
3 Execution Rules
3. Avoid Common Trading Pitfalls: Always wait for a confirmation candle before entering a trade position, and avoid trading blindly against the prevailing primary trend.
Key Takeaway: The Piercing Line reveals seller exhaustion and an aggressive buyer comeback at market lows. Confirm the 50% body penetration and follow-through close, anchor your Stop Loss below the pattern low, and target nearby resistance.

The Bullish Harami is a two-candle pattern that signals potential upward momentum and a bullish trend reversal. It forms at the base of an existing downtrend when a large bearish candle completely encloses a smaller, subsequent bullish candle within its real body.
Quick-Reference Specifications
Market Psychology: Selling Exhaustion & Price Floor
Following an active downtrend where sellers dominated, price action stalls. The second candle forms a small bullish body contained within the previous large red candle's real body. This visual structure reflects selling pressure exhausting as buyers step in, creating market indecision and establishing a potential price floor.
3 Execution Rules
Key Takeaway: The Bullish Harami signals buyer entry and seller exhaustion at market lows. Confirm the breakout above the pattern high, anchor your Stop Loss below the pattern low, and trade in alignment with the broader market context.