

Trading Strategies Explained

A Bear Trap is a classic market manipulation technique that unexpectedly entices sellers and presents high-probability buying opportunities. This pattern occurs in forex trading strategies when price action breaks below a critical support level, misleading retail traders into believing a downward trend is ongoing, only to reverse aggressively upward.
Understanding this dynamic is crucial for traders to avoid getting trapped and instead align their trades with institutional momentum.
1. Support Level Breakdown: The price moves downward, breaking below an established support level. This false breakdown creates the illusion of a continuing bearish trend, encouraging retail traders to open short positions.
2. Liquidity Zone & Stop Hunt: Institutional buyers push the price into a key liquidity zone underneath the support level. This action triggers sell-stop orders and breakout short positions, generating the substantial liquidity needed for institutions to absorb buy orders at discounted rates.
3. Bullish Confirmation Entry: The price quickly rebounds from the lower levels and moves back upward. A candlestick that closes above the original support line confirms the fakeout. This provides an ideal entry point, triggered by the candle close or a brief retest of the level.
4. Defined Profit Targets: As those trapped in short positions are compelled to buy back to cover losses, upward price movement accelerates. Set Take Profit targets (TP1 and TP2) at logical swing peaks or major resistance levels above, while placing a Stop Loss just below the lowest wick of the liquidity sweep. This approach effectively utilizes technical analysis patterns to maximize potential gains.

A Bull Trap occurs in forex trading when price action breaks out above a major resistance level, creating a false sense of security among retail buyers who believe a bullish rally is underway, only for the price to quickly reverse downward. Understanding how institutions utilize market manipulation techniques to execute this liquidity sweep enables traders to avoid buying at the peak and instead position themselves for high-probability short setups using recognized technical analysis patterns.
1. Resistance Breakout & Stop Hunt: Price pushes aggressively upward and breaks above an established resistance level. This artificial breakout generates false bullish sentiment, prompting retail traders to buy the breakout while triggering buy-stop losses from existing short positions.
2. Liquidity Zone Rejection: Market makers and institutional sellers take advantage of this influx of buy orders to fill large sell positions at premium prices. As price gets rejected in this liquidity zone above resistance, late buyers find themselves trapped at the top.
3. Reversal Confirmation Entry: Price reverses sharply and closes back below the original resistance level. This candle close verifies the false breakout and signals a short entry point. Set a Stop Loss just above the highest wick in the liquidity rejection zone.
4. Take Profit Targets & Expected Direction: With trapped buyers forced to exit their positions and momentum shifting bearish, price drops rapidly toward lower liquidity zones. Scale out by setting Take Profit 1 and 2 at key support levels or recent swing lows as the market descends.
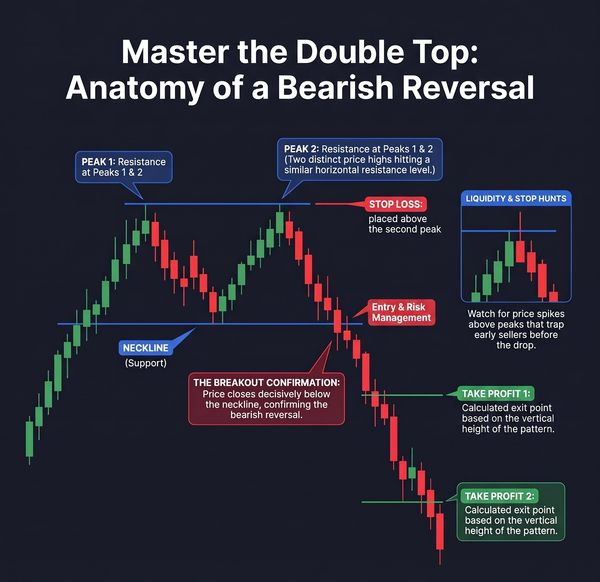
The Double Top is a classic technical chart pattern that signals a transition from an uptrend to a downtrend. It forms when buyers make two consecutive attempts to push price past a key resistance level, fail both times, and lose control to institutional selling pressure.
1. Peak 1 & Peak 2 (Resistance) Price rallies to establish the first peak before pulling back to form a temporary support level known as the Neckline. Buyers attempt to push price up again, but the rally stalls out at a similar horizontal price high (Peak 2), signaling weakening buyers.
2. Liquidity & Stop Hunts Be mindful of temporary price spikes above the peaks during Peak 2. Market makers often trigger buy-stops and sweep liquidity above Resistance to trap early sellers and fill institutional sell orders before the major decline.
3. The Breakout Confirmation & Entry The bearish reversal is official when price drops and closes decisively below the Neckline (Support). This candle close serves as the main entry signal to open a short position. Place your Stop Loss above Peak 2 to manage risk.
4. Take Profit Targets Target exit points by measuring the vertical height between the Resistance line and the Neckline. Use this distance to project downwards from the breakout point, setting Take Profit 1 and Take Profit 2 at calculated support projections below.
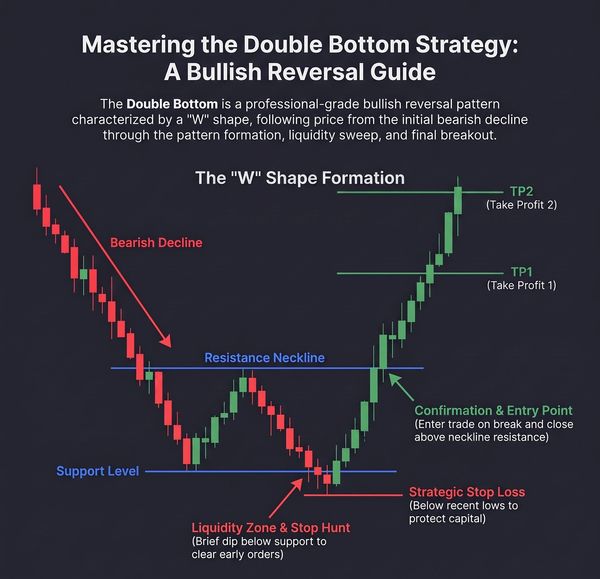
The Double Bottom is a professional-grade bullish reversal pattern characterized by a distinct "W" shape. It signals a shift from an extended bearish decline to an upward rally, tracking price as sellers lose momentum, institutions sweep liquidity, and buyers take full control.
1. Bearish Decline & Support Test Following an initial price decline, market sellers test a key support level to form the first bottom of the "W" pattern. Price temporarily rallies up off this level to establish the Resistance Neckline before turning back down for a second test.
2. Liquidity Zone & Stop Hunt During the second test of support, price briefly dips below the level into a key liquidity zone. This intentional stop hunt clears out early buyer stop-losses and triggers breakout sell orders, generating the liquidity institutions need to absorb large buy positions.
3. Confirmation & Entry Point The bullish reversal is confirmed once price surges back upward and closes decisively above the Resistance Neckline. This breakout candle close acts as the trigger to enter a long position. Position a Strategic Stop Loss safely below the recent lows to protect your capital.
4. Profit Targets (TP1 & TP2) As trapped short sellers cover their positions and new buyers jump in, price expands rapidly upward. Calculate measured exit targets based on the vertical height of the pattern, placing Take Profit 1 (TP1) and Take Profit 2 (TP2) at logical key levels during the ascent.
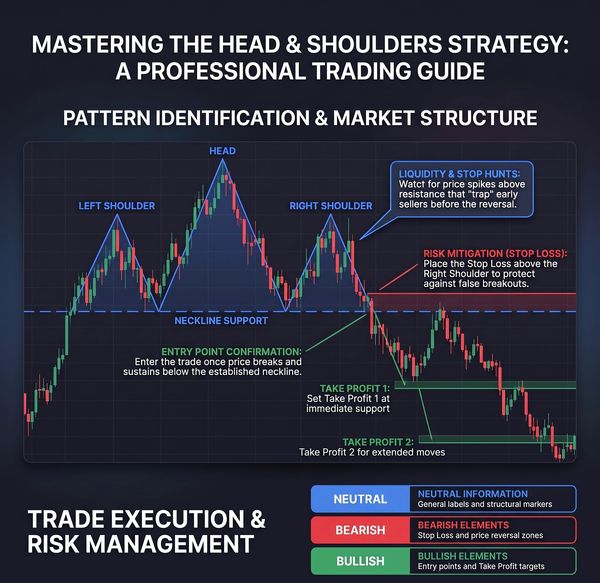
The Head & Shoulders pattern is one of the most reliable chart formations used to identify major trend reversals. It signals a shift from an bullish uptrend to a bearish downtrend, mapping the structural transition as buyers lose strength and sellers take control.
1. Pattern Identification & Market Structure The formation consists of three distinct price peaks: the Left Shoulder, a higher central peak known as the Head, and a lower third peak called the Right Shoulder. Connecting the reaction lows between these peaks establishes the Neckline Support line.
2. Liquidity & Stop Hunts Watch for minor price spikes or wicks around resistance levels (such as during the formation of the Right Shoulder). Market makers often use these quick pushes to trap early sellers and hunt liquidity before initiating the broader downward movement.
3. Entry Point Confirmation & Risk Mitigation The trade triggers once price breaks and sustains a candle close below the established Neckline Support line. For effective risk management, place a Stop Loss above the high of the Right Shoulder to protect your capital against false breakouts.
4. Take Profit Targets (TP1 & TP2) As downward momentum builds, lock in gains by scaling out at structured levels. Set Take Profit 1 at the immediate key support zone below, and target Take Profit 2 for extended downward moves based on the measured height of the pattern.
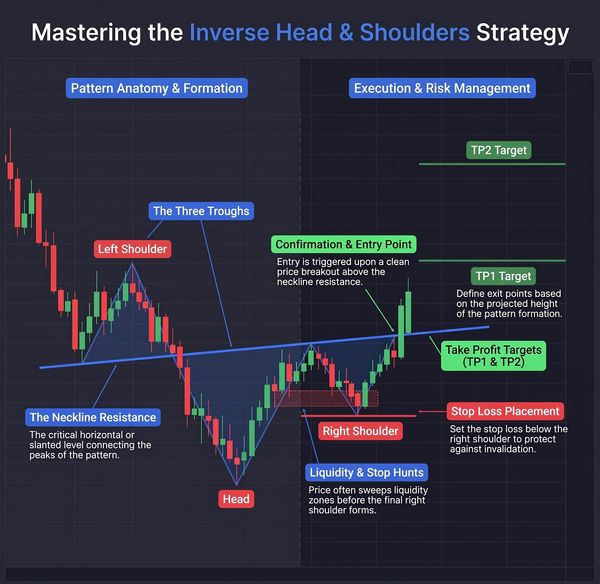
The Inverse Head & Shoulders pattern is a major bullish reversal chart setup. It marks the transition from a prolonged markdown phase to an upward expansion, charting the shift as sellers exhaust their momentum and buyers take back control of the market.
1. Pattern Anatomy & The Three Troughs The structure is formed by three distinct low points (troughs): the Left Shoulder, the deeper central trough known as the Head, and the final higher low called the Right Shoulder. Connecting the reaction highs between these troughs creates the Neckline Resistance line (which can be horizontal or slanted).
2. Liquidity & Stop Hunts As the Right Shoulder develops, price frequently sweeps into liquidity zones (highlighted red region). Market makers use this move to clear out early buyer stop-losses and grab necessary sell liquidity before launching the final upward breakout.
3. Confirmation & Entry Point A valid long trade entry is triggered upon a clean price breakout and candle close above the Neckline Resistance line. To protect your capital against trade invalidation, place your Stop Loss safely below the low of the Right Shoulder.
4. Take Profit Targets (TP1 & TP2) As breakout momentum accelerates, lock in profits at structured technical levels. Measure the vertical distance from the bottom of the Head to the Neckline to project your Take Profit targets (TP1 and TP2) above the breakout point.
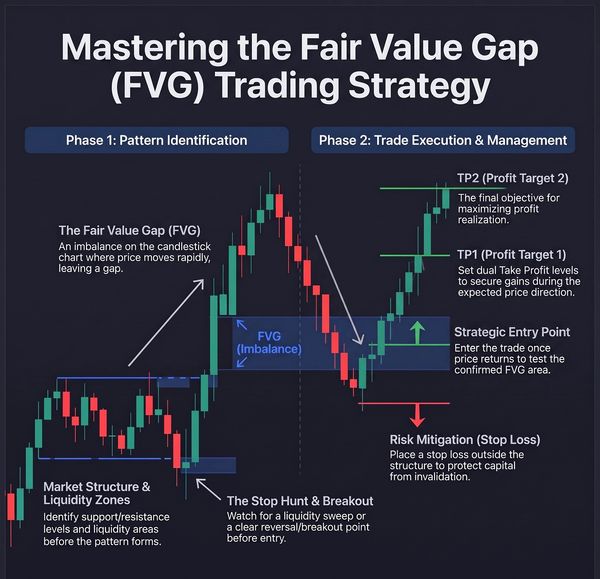
A Fair Value Gap (FVG) is an institutional price imbalance created when aggressive market orders drive price rapidly in one direction, leaving an inefficiency between candlestick wicks. Because markets naturally seek balance, price often retraces to retest this imbalance zone before continuing its main trend.
1. Market Structure & Liquidity Zones Start by identifying key support, resistance, and consolidation zones where liquidity accumulates. A stop hunt or liquidity sweep often occurs right at key structural points, setting up the aggressive displacement move.
2. The Stop Hunt & Breakout Look for a quick liquidity sweep followed by a sharp reversal or breakout. This rapid move creates a 3-candle sequence where Candle 1’s high and Candle 3’s low do not overlap, forming the Fair Value Gap (Imbalance) zone.
3. Strategic Entry Point & Risk Mitigation Wait patiently as price retraces back down to test the confirmed FVG area. Enter a long trade once price taps into this imbalance. Place your Stop Loss safely below the local market structure low to protect your capital against trade invalidation.
4. Take Profit Targets (TP1 & TP2) As the market fills the imbalance and resumes its original expansion upward, set dual exit levels to maximize gains. Use Take Profit 1 (TP1) to lock in profits at intermediate resistance, and let Take Profit 2 (TP2) target major swing highs for full realization.
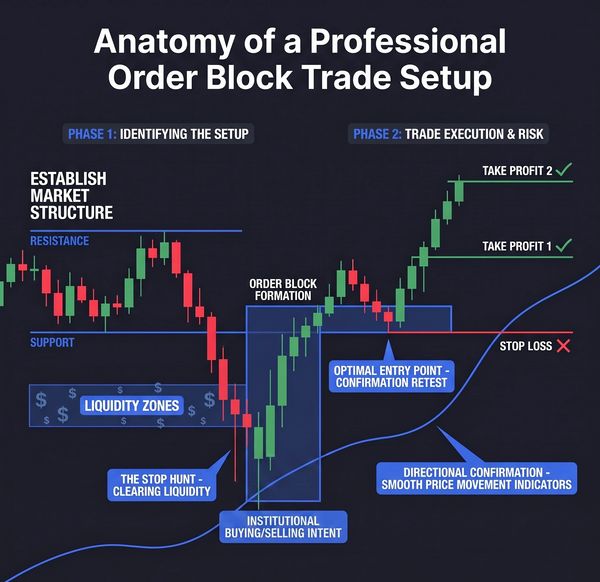
An Order Block represents a specific price zone where institutional market participants place massive buy or sell orders. When price aggressively expands away from this area, it leaves unfulfilled institutional orders behind, creating a high-probability zone for a trade entry when price returns.
1. Establish Market Structure & Liquidity Zones Identify the macro market boundaries by defining key Support and Resistance levels. Liquidity accumulates just beneath key support levels where retail stop-losses sit, creating ideal conditions for an institutional liquidity grab.
2. The Stop Hunt & Order Block Formation Price breaks below established support to execute a Stop Hunt, clearing liquidity and triggering retail sell-stops. Immediately after, strong institutional buy orders surge in, producing a rapid, bullish expansion that creates the Order Block formation.
3. Optimal Entry Point & Risk Management Wait for price to pull back to the Order Block zone. The Optimal Entry Point triggers on a confirmation retest of the top or midpoint of the Order Block. Place your Stop Loss directly below the Order Block and recent swing low to manage risk against trade invalidation.
4. Directional Confirmation & Profit Targets As directional momentum aligns and indicators support the bullish move, price accelerates higher. Target scale-out points by setting Take Profit 1 at immediate structural resistance and Take Profit 2 at major swing highs above.

A Break of Structure (BOS) occurs when price action decisively breaks past a key swing high or low, signaling a continuation of the prevailing trend or confirming a market reversal. Identifying an authentic BOS allows traders to align their entries with active institutional momentum rather than getting caught in choppy consolidation.
1. Establish Market Structure & The Stop Hunt Zone Begin by establishing clear support and resistance levels across the trading range. Before the trend shift occurs, watch for price action to sweep into the Stop Hunt Zone below support. This intentional move triggers retail stop-loss orders, gathering the liquidity required to fuel the strong move upward.
2. Break of Structure (BOS) Confirmation The definitive breakout happens when price surges through key resistance with strong momentum. A confirmed candle close above this level marks the official Break of Structure (BOS), validating that buyers are in control and establishing the new directional trend.
3. Optimal Entry Point & Protected Stop Loss Wait for price action to confirm the move—either on the immediate breakout close or on a higher-low pullback toward the broken structure level. Place a Protected Stop Loss safely below the recent swing low and stop-hunt wick to guard against trade invalidation.
4. Scaled Profit Targets As the market continues its upward expansion, manage risk by executing disciplined, scaled exits. Set Take Profit 1 (TP1) and Take Profit 2 (TP2) at logical key levels, previous swing highs, or key liquidity pools above.

A Change of Character (CHOCH) is an early indicator of a market trend reversal. It occurs when price action breaks the most recent structural swing low during an uptrend (or swing high during a downtrend), signaling that institutional control has shifted from buyers to sellers.
1. Establish Market Structure & Stop Hunt Indicator Map out the prevailing uptrend by identifying key Support and Resistance levels. Before the reversal triggers, watch for a final push above resistance—a stop hunt where institutional liquidity is swept into the upper zone to trap buyers at the top.
2. The CHOCH Event & Confirmation The Change of Character event occurs when price aggressively breaks back down and violates the established structural support level. A confirmed candlestick close below this key swing low validates that market structure has shifted from bullish to bearish.
3. Strategic Entry Point & Risk Parameters Enter a short position after price action confirms the CHOCH (often on a brief, lower-high retracement). Position your Stop Loss safely above the recent lower-high swing or the top of the stop-hunt wick to manage capital risk.
4. Defined Exit Parameters & Expected Direction Follow the momentum of the confirmed bearish reversal toward key liquidity targets. Establish two distinct exit levels by placing Take Profit 1 (TP1) at the nearest intermediate support and Take Profit 2 (TP2) at the primary major liquidity zone below.
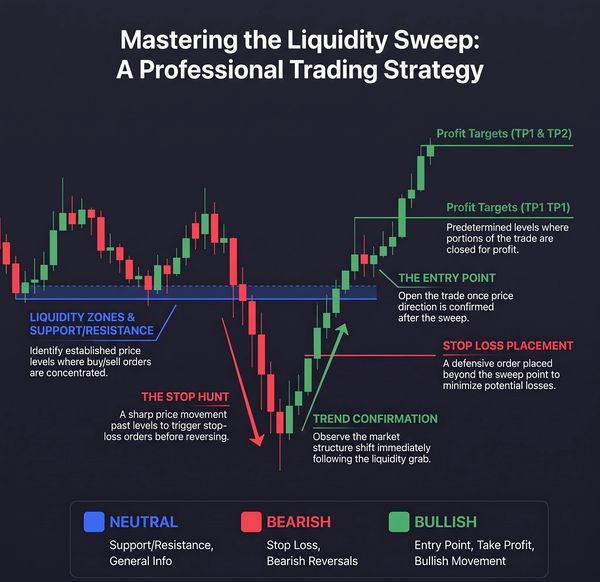
A Liquidity Sweep (or stop hunt) occurs when market makers intentionally push price past key support or resistance levels to trigger resting stop-loss orders. This surge in execution volume provides the necessary liquidity for institutional participants to fill large orders before aggressively reversing price back into the intended direction.
1. Liquidity Zones & Support/Resistance Start by mapping out established price levels where retail buy or sell orders concentrate. Clear support and resistance zones accumulate significant liquidity, making them prime targets for institutional sweeps.
2. The Stop Hunt & Trend Confirmation Watch for a sharp, fast price spike past key support that triggers retail stop-loss orders and breakout sellers. Observe the rapid reversal and market structure shift that immediately follows the liquidity grab, signaling that institutional buying has taken over.
3. Entry Point & Stop Loss Placement Open the trade once price direction is confirmed back above the original key support level. Place a defensive Stop Loss order safely beyond the lowest wick of the sweep point to protect against invalidation and minimize potential losses.
4. Predetermined Profit Targets As the post-sweep momentum accelerates upward, manage risk by locking in gains at predetermined resistance levels. Scale out portions of the position at Take Profit 1 (TP1) and allow the remainder to run toward Take Profit 2 (TP2).
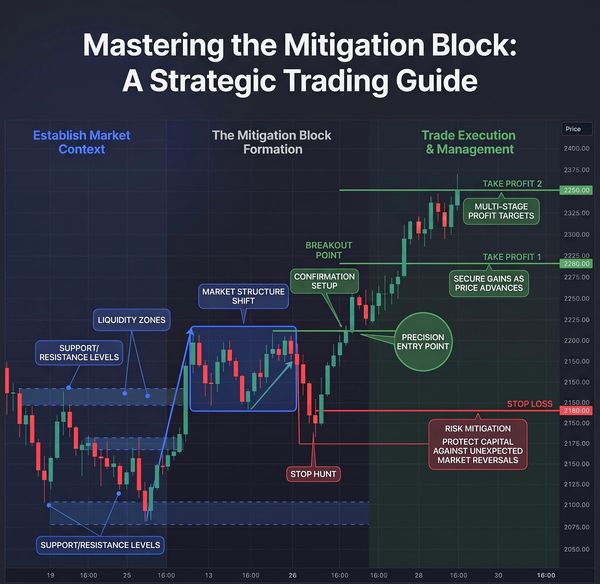
A Mitigation Block occurs when the market forms a order block structure that fails to sweep liquidity (unlike a breaker block), yet still drives a market structure shift. As price pulls back, institutional traders return to this block to close out lingering drawdown positions at breakeven ("mitigating" their losses), creating a high-probability re-entry zone for retail traders to ride the new trend.
1. Establish Market Context Begin by identifying clear Support and Resistance levels along with key Liquidity Zones. Mapping out the broader market structure allows you to distinguish standard range moves from genuine institutional shifts.
2. The Mitigation Block Formation Look for a Market Structure Shift where price expands past key levels without performing a deep stop hunt sweep beforehand. This creates a Mitigation Block zone—an area containing unmitigated institutional orders that must be retested before the market can safely expand upward.
3. Confirmation Setup & Precision Entry Point Wait for price action to retrace into the Mitigation Block zone. The Confirmation Setup occurs when price rejects this zone and pushes through the Breakout Point, offering a Precision Entry Point to enter a long position. Place a Stop Loss below the recent swing low to mitigate risk and protect against unexpected market reversals.
4. Multi-Stage Profit Targets As momentum accelerates past the entry zone, secure gains progressively as price advances. Implement multi-stage exits by placing Take Profit 1 (TP1) at the immediate structural resistance level and Take Profit 2 (TP2) at higher key price targets above.